Student Achievement

Johnson C. Smith University (JCSU) identifies, evaluates, and publishes goals and outcomes for student achievement appropriate to the institution’s mission, the nature of the students the institution serves, and the kinds of programs the institution offers. Moreover, JCSU uses multiple measures to evaluate student success in reaching these goals and outcomes. The Academic Leadership Council is responsible for evaluating and modifying the goals. 


The following sections highlight student achievement in key areas, including (1) gateway course performance; (2) retention rates for undergraduate and graduate students, and (3) graduation rates for undergraduates and graduate students. These sections discuss the justification and appropriateness of the criteria and thresholds of acceptability, evaluation of achievement goals and outcomes, and success regarding student achievement. 

Goals for Student Achievement 


As part of the strategic planning process, the goals and measures for student achievement are determined by the Academic Leadership Council. This group consists of a cross-institutional representation of student-related offices and departments. The Academic Leadership Council convenes on a regular basis, and at least once a year, discusses and reviews the goals and outcomes associated with student achievement as well as makes modifications as necessary. 


The goals for student achievement developed and employed by Johnson C. Smith University are appropriate: 1) for the university’s mission; its 2) students, and 3) programs. All data is published on the University’s Student Achievement page of the website. As noted above, these goals are reviewed by the Academic Leadership Council and are determined appropriate and relevant based on the University’s mission, students, and programs. A summary of the rationale and processes for review are given below, and in each following section presenting overall processes and data related to assessment and appropriateness of outcomes and direct linkages to the mission, students, and programs are elaborated.
 

  1. University Mission 

    Johnson C. Smith’s mission endeavors to prepare and graduate “a diverse group of talented and highly motivated students who can communicate effectively, think critically and learn independently as well as collaboratively.”  


    The University monitors and assesses its goals for student achievement with a particular focus on effective communication, both written and oral, as well as critical thinking and independent research. As the sections below lay out, we monitor and evaluate student performance in core Foundations Gateway Courses that address these goals (Criterion 1: Gateway Course Performance), and we evaluate student persistence and graduations rates across both undergraduate and graduate programs. 

     
  2. Johnson C. Smith Students 

    As an HBCU, Johnson C. Smith University’s student body is highly diverse and motivated, with a significant number of first-generation students coming from 30+ states and abroad. The majority of our students (82%) are of traditional college-aged (16-24 years old), and nearly 65% of the student body is Pell-awarded.  


    Our assessments and goals for student achievement, given this population, focus heavily on early acquisition of core skills related to our mission—independent research and learning, critical thinking, effective written and communication. Benchmarks for student achievement are drawn from past student performance, peer institutions (including other similarly sized HBCUs), and comparisons with national samples of student performance on AAC&U VALUE Rubrics and other measures. For JCSU’s graduate program in social work (MSW), benchmarks are based on successful mastery of nine core competencies required by the CSWE.   

     
  3. Johnson C. Smith Programs 
       
    As a liberal arts institution that “endeavors to provide a multicultural and transformative experience” and graduate students equipped to be “global citizens,” our major programs are highly challenging, diverse, and interdisciplinary. Some of the top declared majors represent the gamut of disciplinary approaches, such as Business Administration (220), Sport Management (126), Biology (105), Criminology (78), and Interdisciplinary Studies (64) all claiming healthy enrollment. Emphasis on mastery of core liberal arts skills (effective written communication, oral communication, and critical thinking) is at the heart of our student achievement assessment, and our goals and benchmarks for retention and graduation are tied to the successful translation of these skills into success in disciplinary majors. For the Master’s in Social Work Program (MSW), outcomes are drawn from and tied to learning outcomes mandated by the Council on Social Work Education, which focus on knowledge, values, skills, and cognitive affective processes.  

Criterion 1. Gateway Course Performance 


Threshold of Acceptability (minimum target): Average 1.7 GPA each academic year  

Goal (expected target): Average 2.0 GPA each academic year 


Johnson C. Smith University, in alignment with our mission to train students to think critically and communicate effectively, has focused on student performance in three core general education courses that develop these skills and prepare students for future success – ENG 131 (Composition), MTH 131/133 (Algebra/Survey of Practical Application of Mathematics), and COM 130 (Public Speaking and Communication). The Academic Leadership Council determined that these three courses were appropriate to this criterion based on… In particular, undergraduate students develop both written and oral communication skills in ENG 131 (Composition) and COM 130 (Public Speaking and Communication) which are also measured using AAC&U VALUE Rubrics as part of our overall assessment of general education outcomes in the Liberal Studies Program. 


The University established a target GPA of 2.0 for three gateway courses designed to fulfill its mission of teaching students to think critically and communicate effectively. This benchmark was discussed and re-affirmed by the Academic Leadership Council in May 2022. Although the courses are disaggregated by the type of admission (Biddle Institute vs. Traditional/Regular Admit), the GPA target benchmark remains the same. The minimum Threshold of Acceptability is based on the minimum GPA required to successfully pass the three core courses (ENG 131 and COM 130 require a minimum C for successful completion; MTH 131/133 require a D). 


The table below is disaggregated to reflect both students admitted through our traditional process and those who enter through the Biddle Institute under different criteria. Tracking the success of Biddle Institute students as compared to other incoming students is central to our mission of providing open access and support for students who might otherwise be unable to pursue post-secondary education. 

Table 8.1-1. Gateway Course Performance by Academic Year 


ENG 131

MTH 131/133

COM 130


Target

2.0

2.0

2.0

AY 2019-2020

Regular Admits

3.16

2.53

2.89

Biddle Institute

2.75

2.34

2.73

AY 2020-2021

Regular Admits

2.77

2.64

2.88

Biddle Institute

2.96

2.05

1.97

AY 2021-2022

Regular Admits

2.15

2.06

1.76

Biddle Institute

2.09

1.27

1.26


As the table reveals, although we continue to meet the target in ENG 131, average GPAs for all courses have dropped since COVID, most notably since the return to on-campus learning in the fall of 2021. Students in the Biddle Institute admission cohort have seen the steepest challenges, with overall averages short of the benchmark for both MTH 131/133 and COM 130 post-pandemic. One key response to this decline by the institution has been to radically reorganize the University College (which has traditionally directly supported incoming students, in particular those in the Biddle Institute cohorts, with intensive advising and tutoring opportunities).  


We feel the benchmarks established are appropriate in working towards early student success leading to greater retention and success in later course work. These three courses directly address, core skills (effective written and oral communication, critical thinking, and quantitative skills) that foster success in degree program courses. The 2.0 GPA benchmark reflects institutional policy regarding successful retention and progression to degree and is reviewed by the Academic Leadership Council.  

Criterion 2.Retention Rates 


Undergraduate Retention Rates 

Threshold of Acceptability (minimum target): 58% for first-year fall-to-fall retention  

Goal (expected target): 68% for first-year fall-to-fall retention 


JCSU set a modest goal for the academic year 2021-22 of 68% for first-year fall-to-fall retention. This goal was carried over from our last accreditation period and reaffirmed by the Academic Leadership Council. The minimum threshold of acceptability was set at 58%, based on a combination of peer institution averages and previous outcomes. While that goal was significantly lower than the goals for the two previous academic years and the IPEDS Comparison Group Average, it reflected both the impact of COVID-19 on the University and an aspiration to grow beyond the actual retention rates of the two previous academic years. Despite institutional efforts to support student retention during the COVID-19 pandemic, such as distributing free laptops and wi-fi hotspot devices to students, and implementing pass-no pass grading options, the sudden shift to virtual learning was devastating to the University’s student retention efforts. As an HBCU, campus life is a major factor in student satisfaction and retention, and the loss of the on-campus experience was a tremendous impediment. Consequently, in the 2021-2022 academic year, our retention rate fell far below the modest goal we set, dropping to 57%. With the reopening of our campus and the restoration of a more normal on-campus experience, we hope to regain the lost ground and rise to new heights in student retention going forward.  

Table 8.1-2. Retention Rates: Peer Comparisons 

Reporting Year

Peer Comparison Institutions Median

Achievement Goal

Outcome

2022-2023

Not currently available

68%

66%

2021-2022

58.5%

68%

57%

2020-2021

69.5%

68%

65%

2019-2020

59%

68%

66%

Data Source: IPEDS 
Peer institutions included were Bethune-Cookman University, Claflin University, Coker University, and Livingstone College. 

The University recognizes that caring academic professionals, operating from both intrusive and appreciative philosophical stances, are essential to retention efforts and places emphasis on the support of its teacher-advisors and professional staff advisors. To improve student retention and to strengthen existing efforts, the University launched the First-Year Experience (FYE) platform as a component of University College, targeting first-year and undecided students. The FYE administers a scaffolded approach to on-boarding students, organizing all academic support for efficiency and easier access by students. To further improve retention, JCSU is adopting a more comprehensive management system, Navigate, which will begin operation in the spring of 2023. 


In May 2022, the University formed the Enrollment Management Task Force, charged with coordinating and planning efforts to strengthen recruitment and retention. This task force includes representation and input from Admissions and Recruitment, Housing and Residence Life, Information Technology, Academic Advising/Academic Affairs, Student Affairs, the Registrar, Student Accounts, and Financial Aid. The Enrollment Management Task Force has coordinated several efforts to improve retention, including an early spring registration drive in November 2022, initiatives to clarify and assist students with financial aid issues, and working on articulation agreements with community colleges and other institutions to allow easier and more streamlined processes for transfer students to fulfill requirements and graduate from degree programs more efficiently.  


Retention goals are reviewed by the Academic Leadership Council for appropriateness on several criteria, including peer comparison institutions, previous goals and outcomes, and appropriateness for our mission, students, and programs. Enrollment and retention information is also shared with the Board of Trustees for review.  


Graduate Retention Rates 

Threshold of Acceptability (minimum target): 80% 

Goal (expected target): 87% 


Since launching its inaugural cohort (Fall 2014), the Master of Social Work (MSW) Program has continued to achieve success as the only graduate program at the University. The program is accredited by the Council on Social Work Education (CSWE), and its continued reaccreditation is a result of student's successful mastery of nine core competencies required by the CSWE (see CSWE Competencies). Student success, mastery of the competencies, is measured via retention and graduation rates, and the benchmarks for all of the competencies are dictated by the CSWE. Each course, as well as the assignments within the courses, are designed to address the required competencies (see MSW Competency Data). 


The retention rate for MSW graduate students is based on the number of “New” students accepted for the identified academic year by program type and not total enrollment. 

Table 8.1-3. MSW Retention Rate by Enrollment Type 

Reporting Year

Type

Entering Cohort

Retained

Achievement Goal

Outcome

2021-2022

Two-Year

23

13

87%

57%

Advanced Standing

8

8 (Grads)

87%

N/A

2020-2021

Two-Year

22

19

87%

86%

Advanced Standing

16

16 (Grads)

87%

N/A

2019-2022

Two-Year

16

16

87%

100%

Advanced Standing

16

15 (Grads)

87%

0%

2018-2019

Two-Year

25

20

87%

80%

Advanced Standing

21

17 (Grads)

87%

0%

2017-2018

Two-Year

32

26

87%

81%

Advanced Standing

13

13 (Grads)

87%

N/A


The success of students in the two-year program exceeds the aforementioned standard. Although retention is not the goal for the advanced standing (AS) program, the MSW faculty have made concerted effort to address challenges that have prevented those students from completing. Failure to complete either program is largely due to cost--especially for the two-year program, which is where the majority of the attrition exists. For the 2021 entering cohort, eight students were unable to enroll due to finances, which is an unusually high number. The program has support for students through the Duke Fellowship, which will help with financial concerns for the next two years, and faculty are seeking other funding once it depletes. 


A second factor impacting retention pertains to academic progress. All students must maintain a 3.0 cumulative GPA to remain in the program, and they cannot earn more than two Cs. A student whose GPA falls below a 3.0 is placed on probation, and they must reach a 3.0 at the end of the next semester to avoid dismissal from the program. Students provisionally accepted into the two-year program (undergraduate GPA does not meet the 3.0 admission requirement) must have a 3.0 at the end of the first year to continue. Students in academic trouble are required to meet with academic advisors twice each semester to ensure they are making satisfactory progress. 

Criterion 3. Graduation Rates 


Undergraduate Graduation Rates 

Threshold of Acceptability (minimum target): 45% for six-year completion rate 

Goal (expected target): 55% for six-year completion rate 


The Student Right-to-Know-Act requires colleges to report the proportion of students “completing their program within 150 percent of the normal time to completion.” For baccalaureate granting institutions, that means the proportion of students who earn bachelor’s degrees within six years. Consequently, the University uses the six-year completion rate by the National Student Clearinghouse as a key success indicator (as indicated to SACSCOC). Based on past performance and a review of data from institutions of like size and mission and considering the likely impact of the COVID-19 pandemic, the University set a six-year completion rate of 45% as the goal for the 2021-2022 academic year. Prior to this decision the rate of 55% had been established by the University's Council of Deans, the predecessor to the Academic Leadership Council. 


The table below shows that with exception of the 2013-2014 entering year (2019 completion year), the University did not meet its goal. Note that comparisons for the 2016-2017 entering year were not available from the National Student Clearinghouse. To address financial hindrances to degree completion, the University’s Gap Scholarship was directed with priority toward upper-class students.

Table 8.1-4. Undergraduate Completion Rate: National Comparisons 

Entering Year

National Comparison of Institutions

Achievement Goal

Outcome

2013-2014

74.4%

53%

54.5%

2014-2015

74.7%

55%

50.9%

2015-2016

76.3%

55%

46.2%

Data Source: National Student Clearinghouse

In 2018, new advising forms were created for each major. Although all advisors can access a student’s information on the Jenzabar academic portal, some information was missing, and advisors did not always have a way to communicate with each other. The new forms not only created an accurate picture of a student’s progress, but sharing these forms between those who work with individual students ensures that everyone remains up-to-date on substitutions, concerns, etc. To help address issues related to the data, student access, and advisor communication, the University is adding Navigate, which will further assist students and advisors with planning and information access.  


To ensure academic advisors were speaking with one voice and had access to those making decisions surrounding advising, the JCSU Academic Advising Collective (JAAC) Committee was created in late 2020. The Committee discusses retention related concerns regularly, and it communicates these concerns to the administration largely through the Enrollment Management Task Force. Now in its second year, this Committee, which consists of those responsible for enrollment and retention, meets regularly to monitor enrollment goals and progress and troubleshoot issues negatively affecting enrollment and retention. In the fall of 2022, the first Advising Blitz was held in the cafeteria, and was an attempt to bring advisors, financial aid, etc., to the students to assist with registration for the spring semester. The success of the Advising Blitz made it a permanent part of the academic calendar, and it will be held each semester to help students get registered.  


The Gold(en) Blueprint Strategic Plan, launched in 2021, directly addresses both issues of retention and graduation. Objectives 2.2 (Improve student persistence and on-time degree completion), 2.3 (Build and strengthen university-wide academic programming and student support services that address the total well-being of students), and 2.4 (Develop and integrate opportunities for professional and postgraduate development across the academy) all directly address student retention, graduation, and overall success. In November 2021, Charlotte Mayor Vi Lyles announced her Racial Equity Initiative, which included pledges from The Duke Endowment and several corporations of $80 million to be donated to JCSU to build programs and strengthen academic and student services programs.  


Initiatives related to Strategic Plan Objective 2.1 (Improve student persistence and on-time degree completion) have been developed over the last several years on several fronts. Recognizing the crucial role effective academic advising plays in student retention, JCSU has instituted several practices related to academic advising. Several years ago, the President initiated a 90% registration goal prior to the end of the previous semester. We continue to strive for that goal each semester, coordinating advising efforts across colleges and departments. 


Graduation goals are reviewed by the Academic Leadership Council (see Minutes for Academic Leadership Council Dec 2022) for appropriateness on several criteria, including peer comparison institutions, previous goals and outcomes, and appropriateness for our mission, students, and programs. Additionally, to consider issues of equity, Table 8.1-5 examines completion rates by gender.  

Table 8.1-5. Undergraduate Completion Rates by Gender 


Entering Year 2013

Entering Year 2014

Entering Year 2015

Entering Year 2016

JCSU

55%

51%

46%

46%

Female

63%

54%

54%

53%

Male

43%

37%

37%

37%

Data Source: National Student Clearinghouse

Consistently, females complete at higher rates than males. To address social and academic challenges impacting the retention and completion of male students at the University, JCSU piloted the Becoming Kings initiative in summer 2022, which is a high school to college transition program targeting first-year males who may not typically be eligible for scholarships but who have the academic likelihood for success at the University. The cohort demonstrated a 99% retention rate with almost all earning a 3.0 or better first semester GPA. The institution plans to continue and expand this initiative. 


Graduate Graduation Rates 

Threshold of Acceptability (minimum target): 60% 

Goal (expected target): 80% 


The MSW program revised the graduation target to 87% during its previous CSWE reaffirmation. Since the graduation of the inaugural MSW class of 2016, the program successfully matriculated 96 two-year students (those entering the MSW program without a BSW) and 71 Advanced Standing (AS) students through its full curriculum. The program enrolled 191 students and graduated 167 students--an 88% graduation rate. 

Table 8.1-6. MSW Graduation Rates by Admit Type 

Reporting Year

Type

Entering Cohort

Graduated

Achievement Goal

Outcome

2021-2022

Two-Year

23

--

80%

--

Advanced Standing

8

8

80%

100%

2020-2021

Two-Year

22

19

80%

86%

Advanced Standing

16

16

80%

100%

2019-2022

Two-Year

16

16

80%

100%

Advanced Standing

16

15

80%

94%

2018-2019

Two-Year

25

16

80%

76%

Advanced Standing

19

18

80%

95%

2017-2018

Two-Year

32

19

80%

87%

Advanced Standing

14

14

80%

100%


Completion for the advanced standing (AS) program has been consistently 100%, except for the 2018 and 2019 cohorts. Although the two-year program has not met the target graduation goal except with the 2018 cohort, the MSW faculty have made concerted effort to address challenges, namely seeking funding to address financial concerns. Additionally, the program requires students having academic difficulty to meet with academic advisors twice each semester to ensure they are making satisfactory progress. 

Student Achievement

The University identifies, evaluates, and publishes goals and outcomes for student achievement that align with its mission, reflect the characteristics of the students it serves, and are appropriate to the academic programs it offers.

Student achievement goals are established and measured in the following areas:

  1. Six-Year Undergraduate Completion Rates
  2. Gateway Course Performance
  3. Retention Rates
  4. Two-Year Graduate rates

Six-Year Undergraduate Completion Rates

  • JCSU Threshold of Acceptability (minimum target): 45% for six-year completion rate  
  • JCSU Goal (expected target): 55% for six-year completion rate  

Figure 8.1-1 Six-Year Undergraduate Completion Rate: National Comparisons

Image
Chart outlining Six-Year Undergraduate Completion Rate: National Comparisons

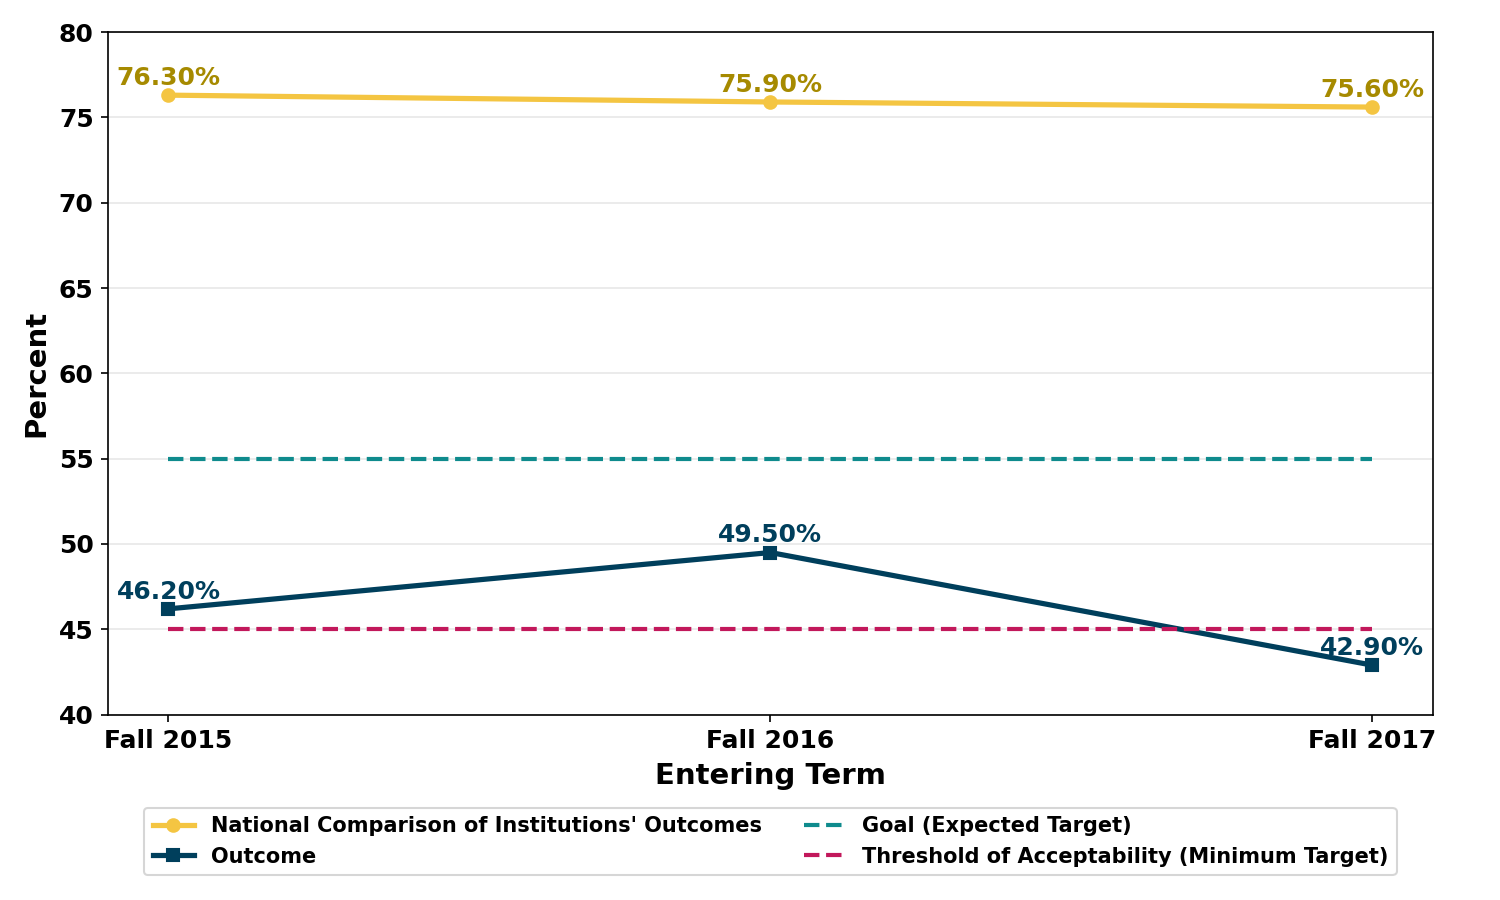
Johnson C. Smith University reports six-year completion rates using data from the National Student Clearinghouse (NSC). NSC tracks students who began at JCSU and completed a bachelor’s degree at JCSU or another four-year institution within six years, regardless of enrollment status.

Results for the entering Fall Cohorts 2015–2017 are shown above. During this period, JCSU’s six-year completion rates ranged from 42.9% to 49.5%, compared to national comparison rates of 75.6% to 76.3%. The University met its minimum threshold of acceptability (45%) for the Fall 2015 and Fall 2016 cohorts. The Fall 2017 cohort fell below the minimum threshold by approximately 2.1 percentage points.

Note that data for the two most recent six-year completion cohorts (Fall 2018 and Fall 2019) are not yet available.

Figure 8.1-2. Six-Year Undergraduate Completion Rates by Gender 

Image
Chart outlining Six-Year Undergraduate Completion Rates by Gender

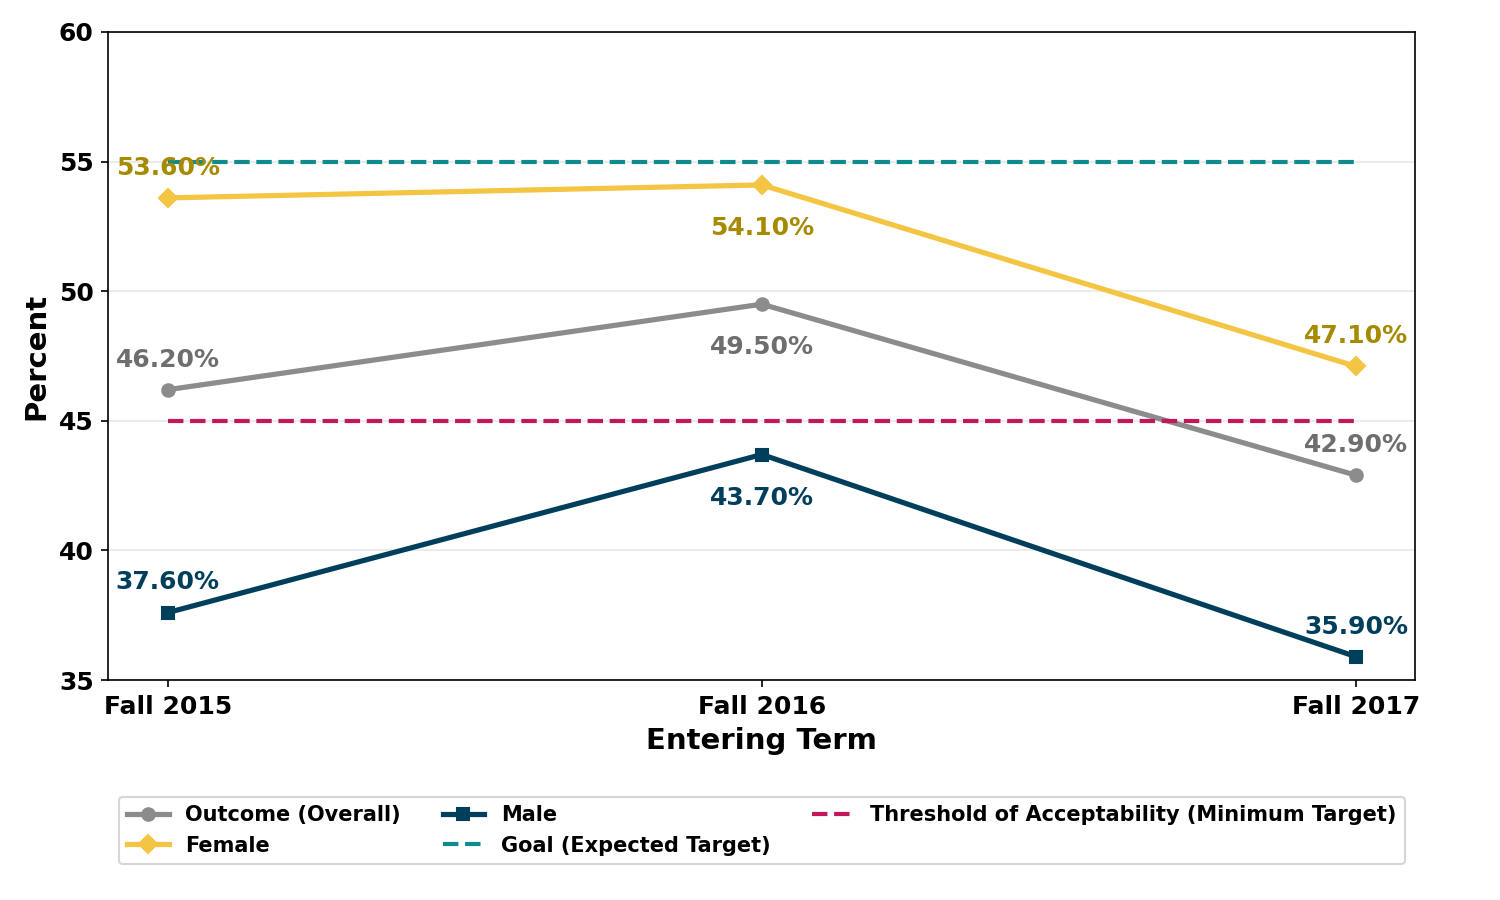
When disaggregated by gender, six-year completion outcomes for Fall Cohorts 2015–2017 show variation between female and male students. During this period, female students’ completion rates ranged from 47.1% to 54.1%, while male students’ completion rates ranged from 35.9% to 43.7%. Female students met the minimum threshold of acceptability (45%) in each cohort shown. Male students did not meet the minimum threshold of acceptability in any of the cohorts shown.


Gateway Course Performance

  • Threshold of Acceptability (minimum target): Average 1.7 GPA each academic year   
  • Goal (expected target): Average 2.0 GPA each academic year

Table 8.1-3. Gateway Course Performance by Academic Year


ENG 131

MTH 131

COM 130


Goal (expected target)

2.0

2.0

2.0

Threshold of Acceptability (minimum target)

1.7

1.7

1.7

AY 2024-2025

Regular Admits

2.59

1.96

2.86

Biddle Institute

2.06

0.90

1.89

AY 2023-2024

Regular Admits

2.89

1.68

2.88

Biddle Institute

2.16

1.10

2.06

AY 2022-2023

Regular Admits

2.56

1.78

2.61

Biddle Institute

1.84

0.91

1.90

Johnson C. Smith University evaluates undergraduate performance in three gateway general education courses: ENG 131 (Composition), MTH 131 (Algebra), and COM 130 (Public Speaking and Communication).

The data shown above are disaggregated by admission type. Regular admits meet or exceed the University’s standard minimum high school GPA requirement of 2.5, while Biddle Institute admits enter the University with a high school GPA below the standard minimum requirement.

Across Academic Years 2022–2023 through 2024–2025, Regular admits recorded average GPAs above or near the minimum threshold of acceptability (1.7) in all three gateway courses and met or exceeded the expected target (2.0) in ENG 131 and COM 130 in all years. Biddle Institute admits met the minimum threshold in ENG 131 and COM 130 in all years and met the expected target in ENG 131 in 2023–2024 and 2024–2025, and in COM 130 in 2023–2024. MTH 131 remained a challenge for Biddle admits, as they did not meet the minimum threshold or expected target in any year.

Retention Rates

Undergraduate Retention

  • Threshold of Acceptability (minimum target): 58% fall-to-fall retention
  • Goal (expected target): 68% fall-to-fall retention  

Figure 8.1-4. Full-Time, First-Time Degree-Seeking Undergraduate Retention Rates
 

Image
chart showing Full-Time, First-Time Degree-Seeking Undergraduate Retention Rates

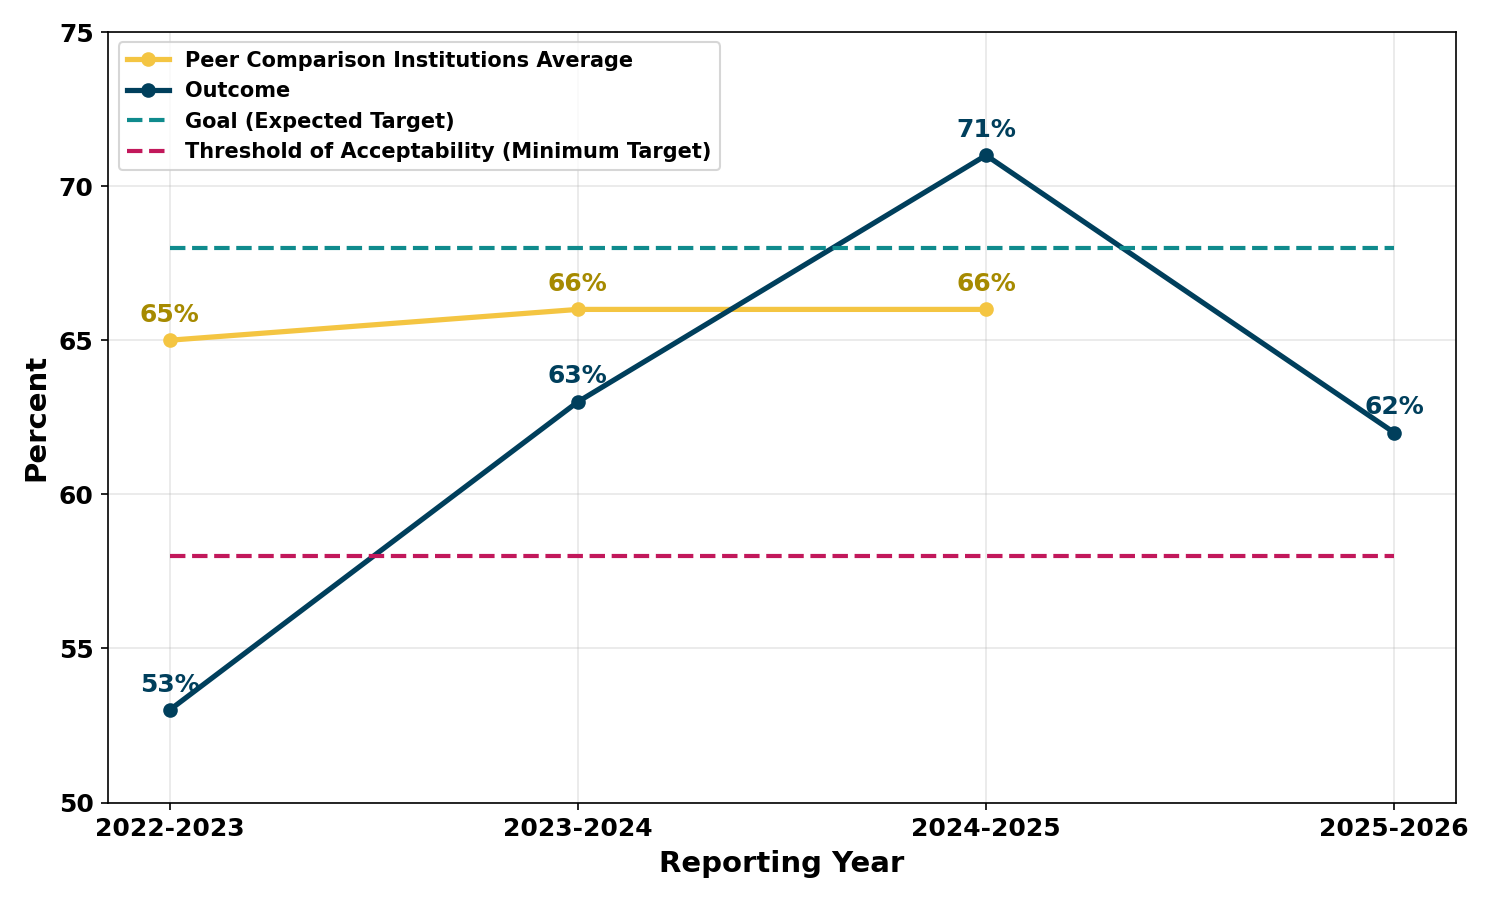
Johnson C. Smith University tracks retention rates for full-time, first-time degree-seeking undergraduate students, measured as the percentage of students who return the following fall semester. Every reporting year tracks the previous Fall Cohort retention.

The data shown above are compared to peer institution averages when available and are evaluated against the University’s minimum threshold of acceptability (58%) and expected target (68%).

Across the last four reporting years, the University met or exceeded the minimum threshold of acceptability (58%) in the three most recent years. The expected target (68%) was met in 2024–2025, when the University also exceeded the peer comparison average of 66%. In the other years, outcomes fell below the expected target. IPEDS Peer comparison data are available for Reporting Years 2022-2023 through 2024–2025.

Graduate Retention (MSW Two-Year)

  • Threshold of Acceptability (minimum target): 80% fall-to-fall
  • Goal (expected target): 87% fall-to-fall

Figure 8.1-5. MSW Retention Rate - Two Year

Image
Chart showing MSW Retention Rate - Two Year

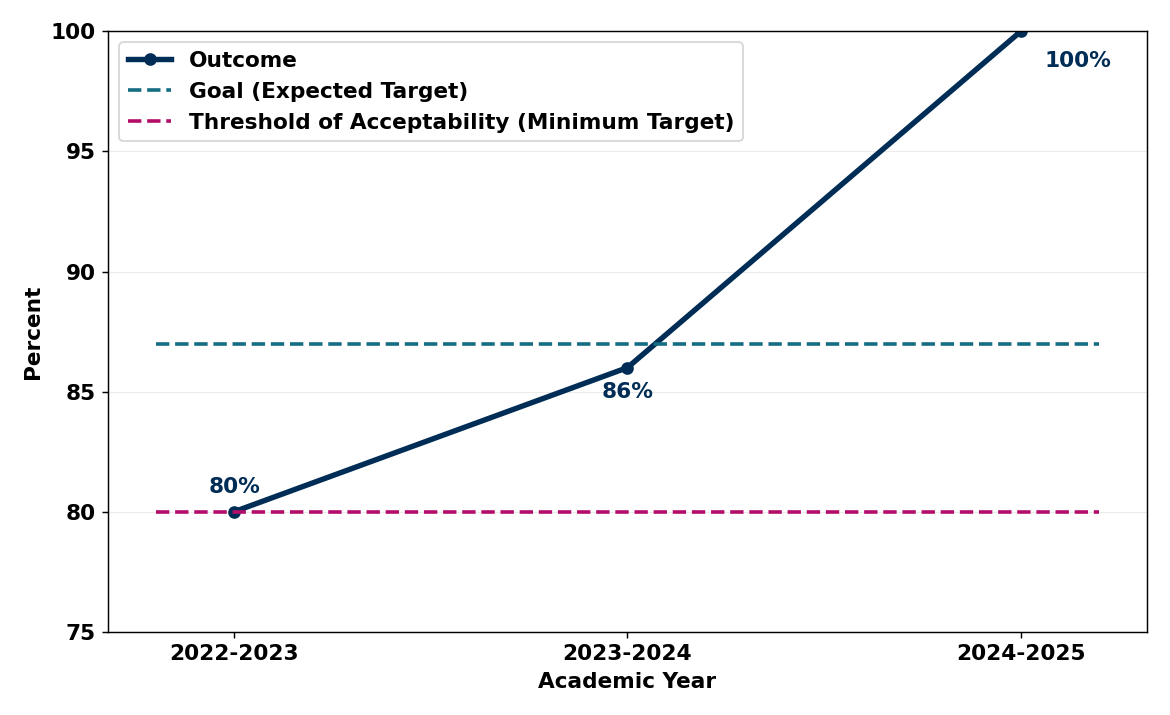
Retention in the two-year Master of Social Work (MSW) program is measured as the percentage of students who enroll in the second year after completing their first year.

The data above are evaluated against the University’s minimum threshold of acceptability (80%) and expected target (87%).

Across Academic Years 2022–2023 through 2024–2025, the two-year MSW program consistently met the minimum threshold of 80%. The expected target of 87% was met by the 2024–2025 cohort, when the program achieved a 100% retention rate. Outcomes in 2023–2024 and 2022–2023 fell just below the expected target, with retention rates of 86% and 80%, respectively.


Two-Year Graduate Rates

  • Threshold of Acceptability (minimum target): 60% graduation rate
  • Goal (expected target): 80% graduation rate

Figure 8.1-6. MSW Graduation Rates by Admit Type

Image
Chart showing MSW Graduation Rates by Admit Type

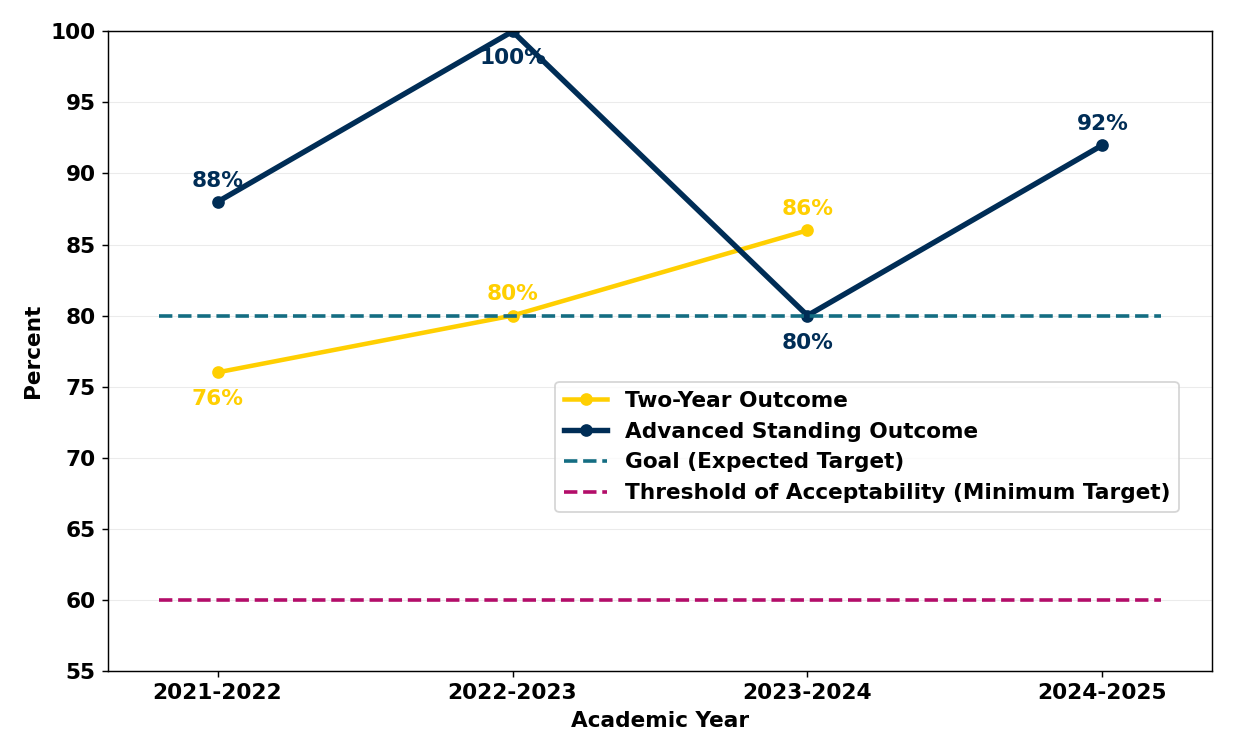
Johnson C. Smith University tracks graduation rates for both the two-year and advanced standing Master of Social Work (MSW) programs. Graduation rates are evaluated against the University’s minimum threshold of acceptability (60%) and expected target (80%).

Across Academic Years 2021–2022 through 2024–2025, the advanced standing program consistently met or exceeded the expected target, with graduation rates ranging from 80% to 100%. The two-year program also met or exceeded the minimum threshold in all years; outcomes met or exceeded the expected target in 2022–2023 and 2023–2024, while the 2021–2022 cohort fell just below the expected target at 76%. The graduation rate for the 2024–2025 two-year cohort will be available in June 2026.


Back To Top